


It’s hot. Real hot. Heat waves in the United States surely must be the most visible and impactful sign of human caused climate change, right? Well, actually no. Let’s take a look at what the U.S. National Climate Assessment and the Intergovernmental Panel on Climate Change say about heat waves in the United States. What they say may surprise you.
Before proceeding, let me emphasize that human-caused climate change is real and significant. Aggressive policies focused on both adaptation and mitigation make very good sense. So too does being accurate about current scientific understandings. The importance of climate change does not mean that we can ignore scientific integrity - actually the opposite, it makes it all the more important. So let’s take a close look at recent assessment reports and what they say about U.S. heat waves.
The figure below comes out of the most recent U.S. National Climate Assessment (NCA). It shows the frequency (top) and intensity (bottom) of heat waves in the U.S. since 1900. The bottom figure is actually based on a paper that I co-authored in 1999, which serves as the basis for an official indicator of climate change used by the Environmental Protection Agency.
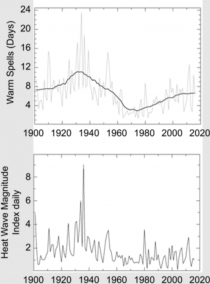
US heat wave frequency (top) and intensity (bottom) since 1900, from the Fourth U.S. National Climate Assessment. Source; USNCA 2017
There are a few things that jump out from these figures. One is that heat waves of recent decades have not reached levels seen in the 1930s, either in their frequency or intensity. The NCA observed that the IPCC (AR5) concluded that “it is very likely that human influence has contributed to the observed changes in frequency and intensity of temperature extremes on the global scale since the mid-20th century.” But at the same time, the NCA also concluded,
In general, however, results for the contiguous United States are not as compelling as for global land areas, in part because detection of changes in U.S. regional temperature extremes is affected by extreme temperature in the 1930s.
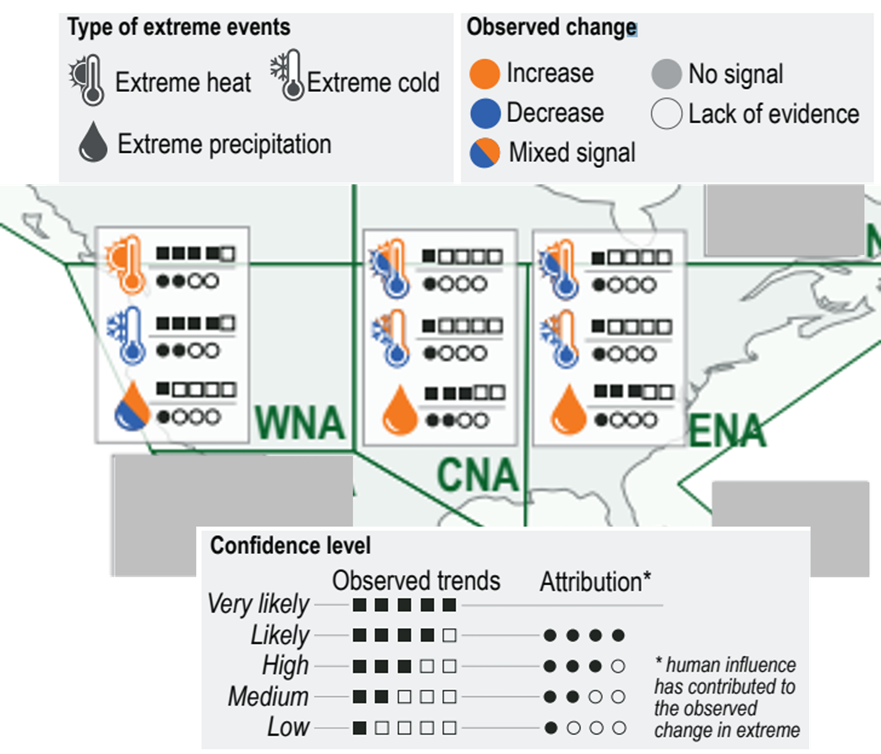
The more recent IPCC AR6 concurred. The complex figure below (which I consolidated from the even more complex IPCC AR6 Figure 11.4) indicates low confidence (~20%) for the detection of trends in extreme heat and the attribution of those trends to human causes for both central and eastern North America (CNA and ENA). In western North American (WNA) detection is judged likely (>66%) but with low confidence in attribution.
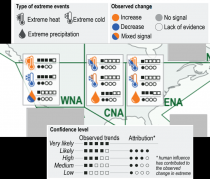
Annotated version of IPCC AR6 Figure 11.6, showing confidence levels in detection and attribution for extreme heat, cold and precipitation for 3 regions in North America, West, Central and East. Source: IPCC 2021
The extreme temperatures of 1930s present a challenge for the detection and attribution of trends in heat waves in the United States. That means that consumers of climate reporting need to have their antennae up when reading about heat waves. It is true that if analysis of data begins in the 1960s, then an increase in heat waves can be shown. However, if the data analyses begins before the 1930s then there is no upwards trend, and a case can even be made for a decline. It is a fertile field for cherry pickers.
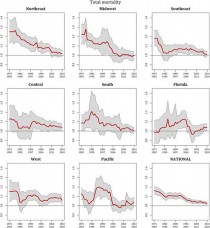
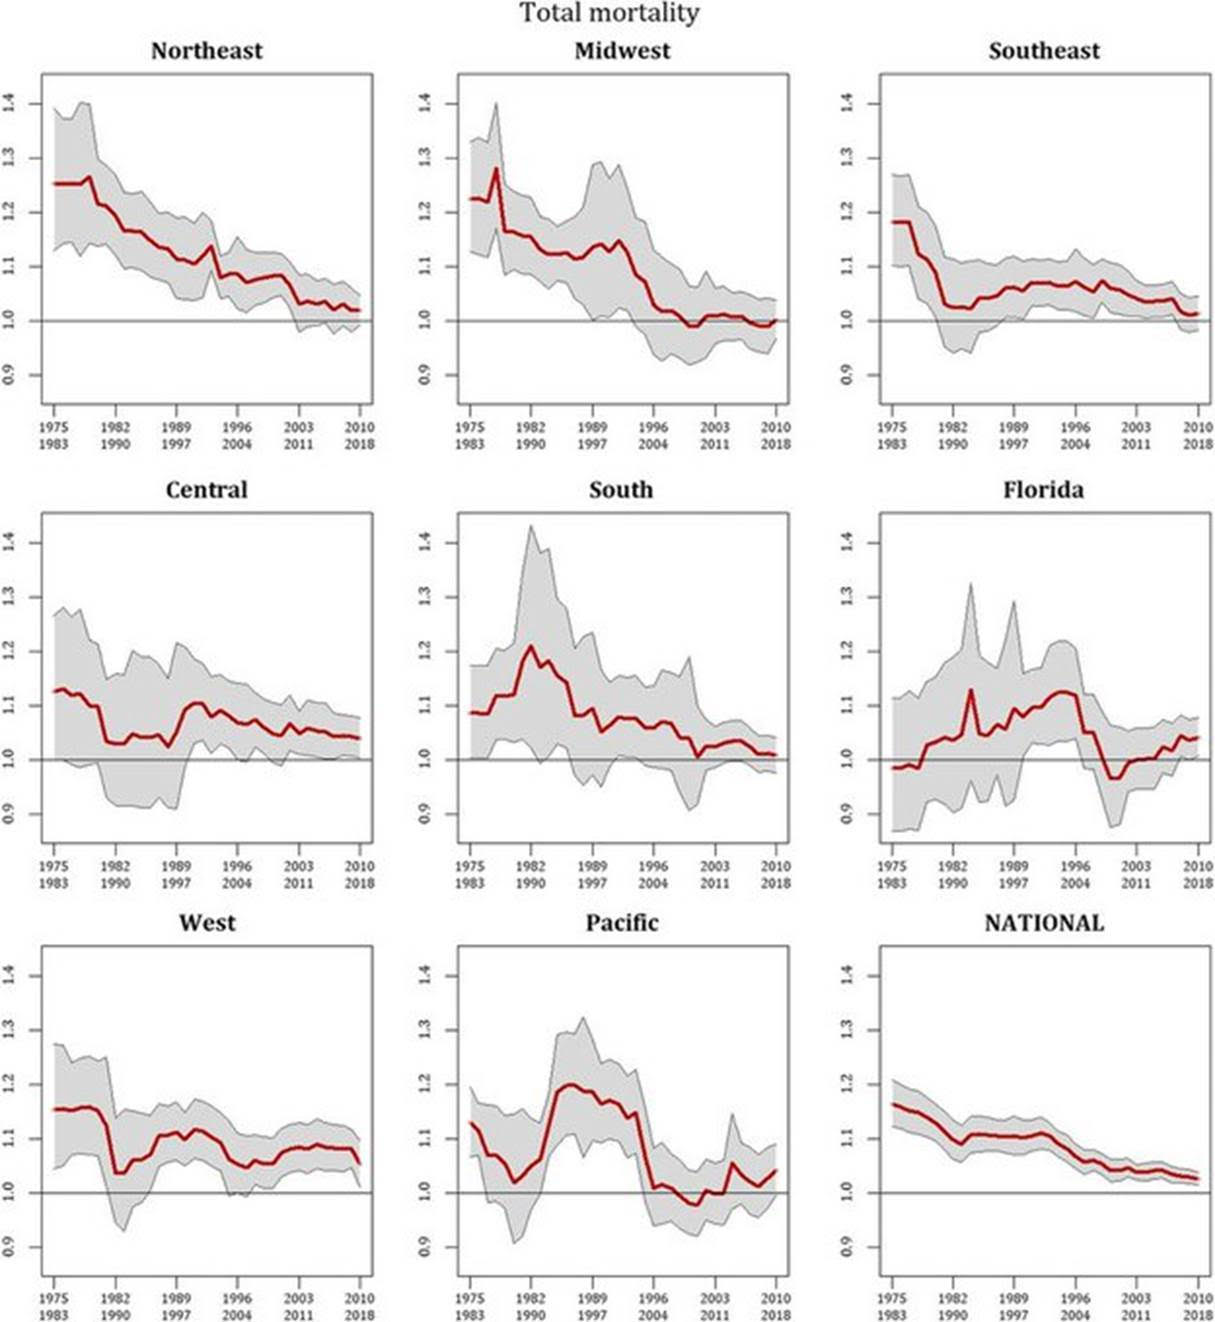
Even though U.S. heat waves have increased since the 1960s, societal vulnerability has decreased over that time. The figure below presents mortality risk in “extreme heat events” across the U.S. since the 1970s, showing an overall decline. This is good news, because it shows that the climate can become more extreme, but society has significant adaptive capacity.
Relative risk by region for total mortality on “extreme heat event” days versus non-extreme heat event days. National total is shown in the bottom right figure. Source: Sheridan et al. 2021
Make no mistake, looking to the future, the IPCC projects an increase in heat waves around the world, including in the United States. Here is what the IPCC projects for the future:
In summary, it is virtually certain that further increases in the intensity and frequency of hot extremes, and decreases in the intensity and frequency of cold extremes, will occur throughout the 21st century and around the world. It is virtually certain that the number of hot days and hot nights and the length, frequency, and/or intensity of warm spells or heatwaves compared to 1995-2014 will increase over most land areas. In most regions, changes in the magnitude of temperature extremes are proportional to global warming levels (high confidence).
How bad things get is a function of how quickly mitigation occurs. Achieving net-zero carbon dioxide is thus not about the weather this year or next, but about what happens later this century.
But regardless how fast we achieve net-zero carbon dioxide, there is good reason to believe that the societal impacts of extreme heat are manageable, and across different scenarios. For instance, according to the World Health Organization, even with increasing heat waves, mortality does not have to increase. Assuming adaptative responses (like air conditioning), the WHO concludes that future “attributable mortality is zero.” The importance of adaptation to reducing vulnerabilities to extreme heat is a robust finding across the literature.
The climate is changing, there is no doubt. In many places around the world the signal of these changes has been observed in the occurrence of heat waves. But the United States is not among those places—not yet.
But so what? If climate change is real and responding to it is important, why does it matter if we incorrectly attribute today’s weather to climate change? Maybe such incorrect attribution will be politically useful?
I can think of two reasons why it matters.
First, our assessment of risk can be skewed. If we think this week’s heat wave is a novel event juiced by climate change, rather than within the bounds of observed variability, then we are fooling ourselves. If electrical grids fail and people die this week, that will mean that we are not even prepared for the present. We need only look back to the 1930s to understand that we are also not prepared for the past, much less a more extreme future. Casual claims of detection and attribution can mislead.
Second, sustained support for action on climate will require also sustaining public and policy maker trust in science and scientific institutions. Claims that go well beyond scientific understandings place that trust at risk. A scientific consensus doesn’t exist only when it is politically useful - it also exists when it is politically unwelcomed. Accurately producing and reporting on scientific assessments surely helps to foster trust in experts and the institutions that they inhabit.
The scientific community and the journalists who report on its findings would do well to call things straight, rather than make a mockery of climate science by quickly claiming that every weather event that just happened was due to climate change.
See here even more recent mortality data that suggests cold is the real danger and killer.
Could Antarctica’s ‘Doomsday Glacier’ meet its doom within 3 years?
“Time is melting away for one of Antarctica’s biggest glaciers, and its rapid deterioration could end with the ice shelf’s complete collapse in just a few years. Alarmist researchers warned at a virtual press briefing on Dec. 13, 2021 at the annual meeting of the American Geophysical Union (AGU), a once outstanding professional society, but now a shill for the left.
Above is the first sentence of the article Titled “Antarctica’s ‘Doomsday Glacier’ could meet its doom within 3 years,” not what we would expect to see from a once reputable source, American Geophysical Union. It warns us that in a few years, the world’s largest glacier, about the size of Florida, will melt and raise ocean levels by up to 3 meters, about 10 ft. It then tells us that the glacier is melting from below because the surrounding ocean waters have been warmed “thanks to human-induced climate change.” Finally, it tells us that a team of more than 100 scientists from the USA and the UK has been studying the Thwaites glacier and sharing their findings with scientists worldwide.
The article then explains that the Thwaites is not melting from above, but “the melting is coming from below,” from the warmed-up oceans that have been warmed by human-made CO2 and the greenhouse effect. The bulk of the article then proceeds to detail the forecasted consequences around the world:
- Flooding in all coastal communities with a dramatic picture of Venice,
- The hundreds of icebergs released to the open oceans,
- How the cataclysmic break-off of this gigantic Thwaites ice shelf may cause an acceleration of the melting of other ice shelves. Etc.
- Concludes how the team of scientists will continue to monitor the developments and keep the scientific community, policymakers, and the public informed.
Read the complete article here. So, even if this crack team of USA and UK scientists kept the world’s scientists informed of their findings, they may not have kept themselves informed of what other scientists were finding.
This team may not have even been communicating with each other. Almost a decade earlier, geologists were seeing evidence of volcanoes in a known active tectonic plate boundary, buried under the glacier and the oceans. Before 2017 at least 47 volcanoes were found in western Antarctica and around the area of the Thwaites glacier. In 2017 the Guardian reported that an additional 91 volcanoes had been found along the western shores of Antarctica, with some sitting under the Twaites glacier itself. See the article “Scientists discover 91 volcanoes below Antarctic ice sheet” here.
So here we have an article by Mindy Weisberger, published December 21, 2021, at least four years after discovering the 91 additional volcanoes (138 total), that does not even mention the word volcanoes, not even once. If our arithmetic is correct, this Thwaites glacier should have broken off around 2019, but it’s still there and still melting from below caused by volcanic activities, yet these useless so called scientists still place all the blame for melting on humans.
What are we to conclude? Was this article an example of an “isolated mistake” by one person/one publisher or another example of the disinformation campaign of the CO2/greenhouse warming alarmists? It is clearly the latter.
Unlike you dear reader who is likely mildly provoked by this.
Human caused climate change lies that surround you on a daily basis, your authors have been immersed in this greatest of all frauds for careers stretching more than half a century. We have researched lies at United Nations conferences back into the 1960s. Therefore it’s makes it impossible for us to avoid the topic at every single social exchange of words. Last week for the junior author it was buying a fuel pump at Advance Auto Parts. Where ever we can , one by one, we try to unburden folks with the lies they have now grown up with. It is a small step for humanity but at days end we feel we have done something to help fight this war of scientific misinformation.
Authors
Terigi Ciccone
Engineer, Science Enthusiast and Artist. Loves reading and travel, Naturalist, Author of the new book “A Hitchhiker’s Journey Through Climate Change.”
Dr. Jay Lehr
CFACT Senior Science Analyst Jay Lehr has authored more than 1,000 magazine and journal articles and 36 books. Jay’s new book A Hitchhikers Journey Through Climate Change written with Teri Ciccone is now available on Kindle and Amazon.